
How to Monitor Self-Hosted n8n with Prometheus and Grafana
 Yulei Chen
When the n8n editor slows down or a webhook takes longer than usual, the execution list tells only part of the story. A metrics dashboard shows whether the n8n process is using more memory, consuming more CPU, or responding more slowly.
In this tutorial, you'll deploy n8n and Grafana from Sliplane presets, then build a small Prometheus image from a GitHub repository. The finished dashboard shows live metrics from your n8n instance.
The setup follows n8n's official Grafana guide, with Sliplane handling the container deployments. It monitors one n8n process and its webhooks. It does not replace n8n's execution history or application-level workflow alerts.
What you'll deploy
| Service | Deployment method | Role |
|---|---|---|
| n8n | Sliplane n8n preset | Runs workflows and exposes metrics on /metrics |
| Prometheus | Custom Docker image built from GitHub | Collects and stores those metrics |
| Grafana | Sliplane Grafana preset | Queries Prometheus and displays dashboards |
Prometheus requests n8n's metrics every 15 seconds. Grafana queries the history stored in Prometheus when you open a dashboard.
Prometheus -- scrapes --> n8n:5678/metrics
Grafana    -- queries --> Prometheus:9090
Deploy all three services on the same Sliplane server. This lets them communicate through internal hostnames. Putting them in the same project helps keep things organized, but the server is what matters for connectivity. See Sliplane's private networking documentation.
This guide uses one n8n instance. If you already have n8n running on Sliplane, start with the metrics configuration in step 2 and use that server for the other services.
1. Deploy the n8n preset
You'll need a Sliplane account, a server with room for all three services, and a GitHub repository for the Prometheus configuration.
Open the n8n preset, select your project and server, and review the deployment settings.
 Deploy n8n >
Keep the preset's persistent volume mounted at /home/node/.n8n and save its generated N8N_ENCRYPTION_KEY. n8n needs the same key to decrypt stored credentials after a redeploy.
Click Deploy, wait for the service to become available, and open its Sliplane domain. Complete n8n's initial owner-account setup.
For a more detailed walkthrough of this part, see self-hosting n8n the easy way.
2. Enable n8n's metrics endpoint
Open the n8n service settings and add the this environment variable:
N8N_METRICS=true
It enables /metrics. Keep the default n8n_ metric prefix so the queries below match your instance. These settings are defined in n8n's metrics configuration.
Save the settings and wait for the redeploy to finish.
Find and copy n8n's internal hostname in Sliplane. Throughout this tutorial, n8n-example.internal is a placeholder for that value. Keep the actual hostname handy for the next step.
The scrape URL will look like this:
http://n8n-example.internal:5678/metrics
Internal addresses are reachable from services on the same server. They won't normally open in your laptop's browser.
n8n warns that /metrics can reveal sensitive operational data. Prometheus uses the internal address in this guide, but a publicly exposed n8n service may still serve the same path on its public domain. Block public requests to /metrics at your ingress or proxy before using this setup for production. If you keep n8n private, route editor access and public webhooks through a controlled private networking or proxy setup.
3. Create the Prometheus image in GitHub
Create a GitHub repository called n8n-monitoring. Add two files at its root:
n8n-monitoring/
├── Dockerfile
└── prometheus.yml
This image uses the official Prometheus image and includes your scrape configuration. Prometheus documents this approach in its custom image instructions.
Add the scrape configuration
Create prometheus.yml:
global:
  scrape_interval: 15s
  scrape_timeout: 10s

scrape_configs:
  - job_name: n8n
    metrics_path: /metrics
    scheme: http
    static_configs:
      - targets:
          - "n8n-example.internal:5678"
Replace n8n-example.internal with the hostname you copied from Sliplane. The target contains only the host and port; the scheme and path have their own settings.
Keep job_name: n8n. Prometheus attaches this job label to the collected series, and our dashboard queries use it to select this instance. The interval and target settings follow the Prometheus configuration reference.
Use the literal hostname here. Adding an environment variable to your Sliplane service won't automatically substitute it into static_configs.targets.
Add the Dockerfile
Create Dockerfile:
FROM prom/prometheus:v3.14.0

COPY prometheus.yml /etc/prometheus/prometheus.yml

RUN /bin/promtool check config /etc/prometheus/prometheus.yml

ENTRYPOINT ["/bin/prometheus"]
CMD ["--config.file=/etc/prometheus/prometheus.yml", "--storage.tsdb.path=/prometheus", "--storage.tsdb.retention.time=15d", "--storage.tsdb.retention.size=5GB", "--web.listen-address=0.0.0.0:9090"]
The example pins Prometheus to v3.14.0, a published release listed on the Prometheus downloads page. When you update it, choose an explicit release tag.
The build runs promtool to catch configuration errors before the image starts. Prometheus writes its data to /prometheus and listens on port 9090.
The retention settings keep up to 15 days of history, deleting older blocks sooner if the size threshold is reached. 5GB is an example retention budget, not a hard limit on total disk usage: the write-ahead log, current data, and compaction need extra space. Adjust it to fit the server that also hosts n8n and Grafana. See Prometheus storage settings.
Commit both files to your repository's main branch. You can create and commit them directly in GitHub's web interface.
4. Deploy Prometheus from the repository
In your Sliplane project, choose Deploy Service and select GitHub as the source. Connect the repository you just created, granting Sliplane access if it doesn't appear in the list.
Use these settings:
| Setting | Value |
|---|---|
| Repository | Your n8n-monitoring repository |
| Branch | main |
| Server | The same server as n8n |
| Public access / Expose service | Disabled; keep Prometheus private |
| Persistent volume | A new volume mounted at /prometheus |
If the deployment fails to find the Dockerfile, fill Dockerfile path with Dockerfile and deploy again.
Sliplane builds the image from your repository and starts the container. This workflow is covered in its GitHub deployment guide.
The volume stores the metrics history across deployments. Attach it to /prometheus; mounting a volume over /etc/prometheus could hide the configuration baked into your image. Sliplane's volume documentation explains how to create and attach one.
Once the service is running, copy its internal hostname. We'll use prometheus-example.internal as the placeholder below.
When you change the scrape configuration later, commit the updated prometheus.yml and deploy a new image. Sliplane deploys new commits automatically when autodeploy is enabled.
5. Deploy Grafana and connect Prometheus
Open the Grafana preset and select the same project and server.
Deploy Grafana >Keep the persistent volume mounted at /var/lib/grafana. It stores Grafana's configuration and saved dashboards. Deploy the service, then open its Sliplane domain.
For a fresh preset deployment without custom admin credentials, sign in with admin / admin and change the password when prompted. See the Sliplane Grafana preset walkthrough.
In Grafana:
- Open Connections > Data sources.
- Select Add new data source, then Prometheus.
- Name it
n8n-prometheus. - Set Prometheus server URL to
http://prometheus-example.internal:9090, replacing the hostname with your actual value. - Set the data source's Scrape interval to
15sto matchprometheus.yml. - Select Save & test.
Grafana should confirm that it can query Prometheus. The connection runs from Grafana's server, so Prometheus can stay private. See Grafana's Prometheus data source configuration.
Don't use localhost:9090 here. Inside Grafana's container, localhost refers to Grafana's own container. Also leave /metrics off this URL: Grafana needs Prometheus's query API.
6. Verify that Prometheus is collecting n8n metrics
Open Explore in Grafana, select n8n-prometheus, switch the query editor to Code, and run:
up{job="n8n"}
A value of 1 means the latest scrape succeeded. A value of 0 means Prometheus has the target configured but couldn't scrape it successfully. Prometheus explains this metric in its jobs and instances guide. An empty result means there isn't a matching series; check the selected data source, job name, and whether the first scrape has happened.
Wait at least two scrape intervals after deployment before checking. To see which n8n metrics are available, run this as an instant query and use the table view:
{job="n8n", __name__=~"n8n_.*"}
This is also a useful check when an imported dashboard shows empty panels. Metric availability depends on your n8n version and the flags you've enabled.
7. Build your first dashboard
Create a dashboard through Dashboards > New > New dashboard, then choose Add visualization and select n8n-prometheus.
Start with these four panels. For each one, switch the query editor to Code, enter the query, choose the visualization and unit, and return to the dashboard.
| Panel | PromQL | Visualization and unit |
|---|---|---|
| Metrics endpoint reachable | up{job="n8n"} | Stat; map 1 to Up and 0 to Down |
| n8n process memory | n8n_process_resident_memory_bytes{job="n8n"} | Time series; bytes (IEC) |
| n8n process CPU | rate(n8n_process_cpu_seconds_total{job="n8n"}[$__rate_interval]) | Time series; custom unit cores |
| n8n process uptime | time() - n8n_process_start_time_seconds{job="n8n"} | Stat; seconds |
For the Stat panels, select the instant query type to show the current value. Set the dashboard time range to Last 30 minutes, enable a 15-second refresh, and save it as n8n overview.
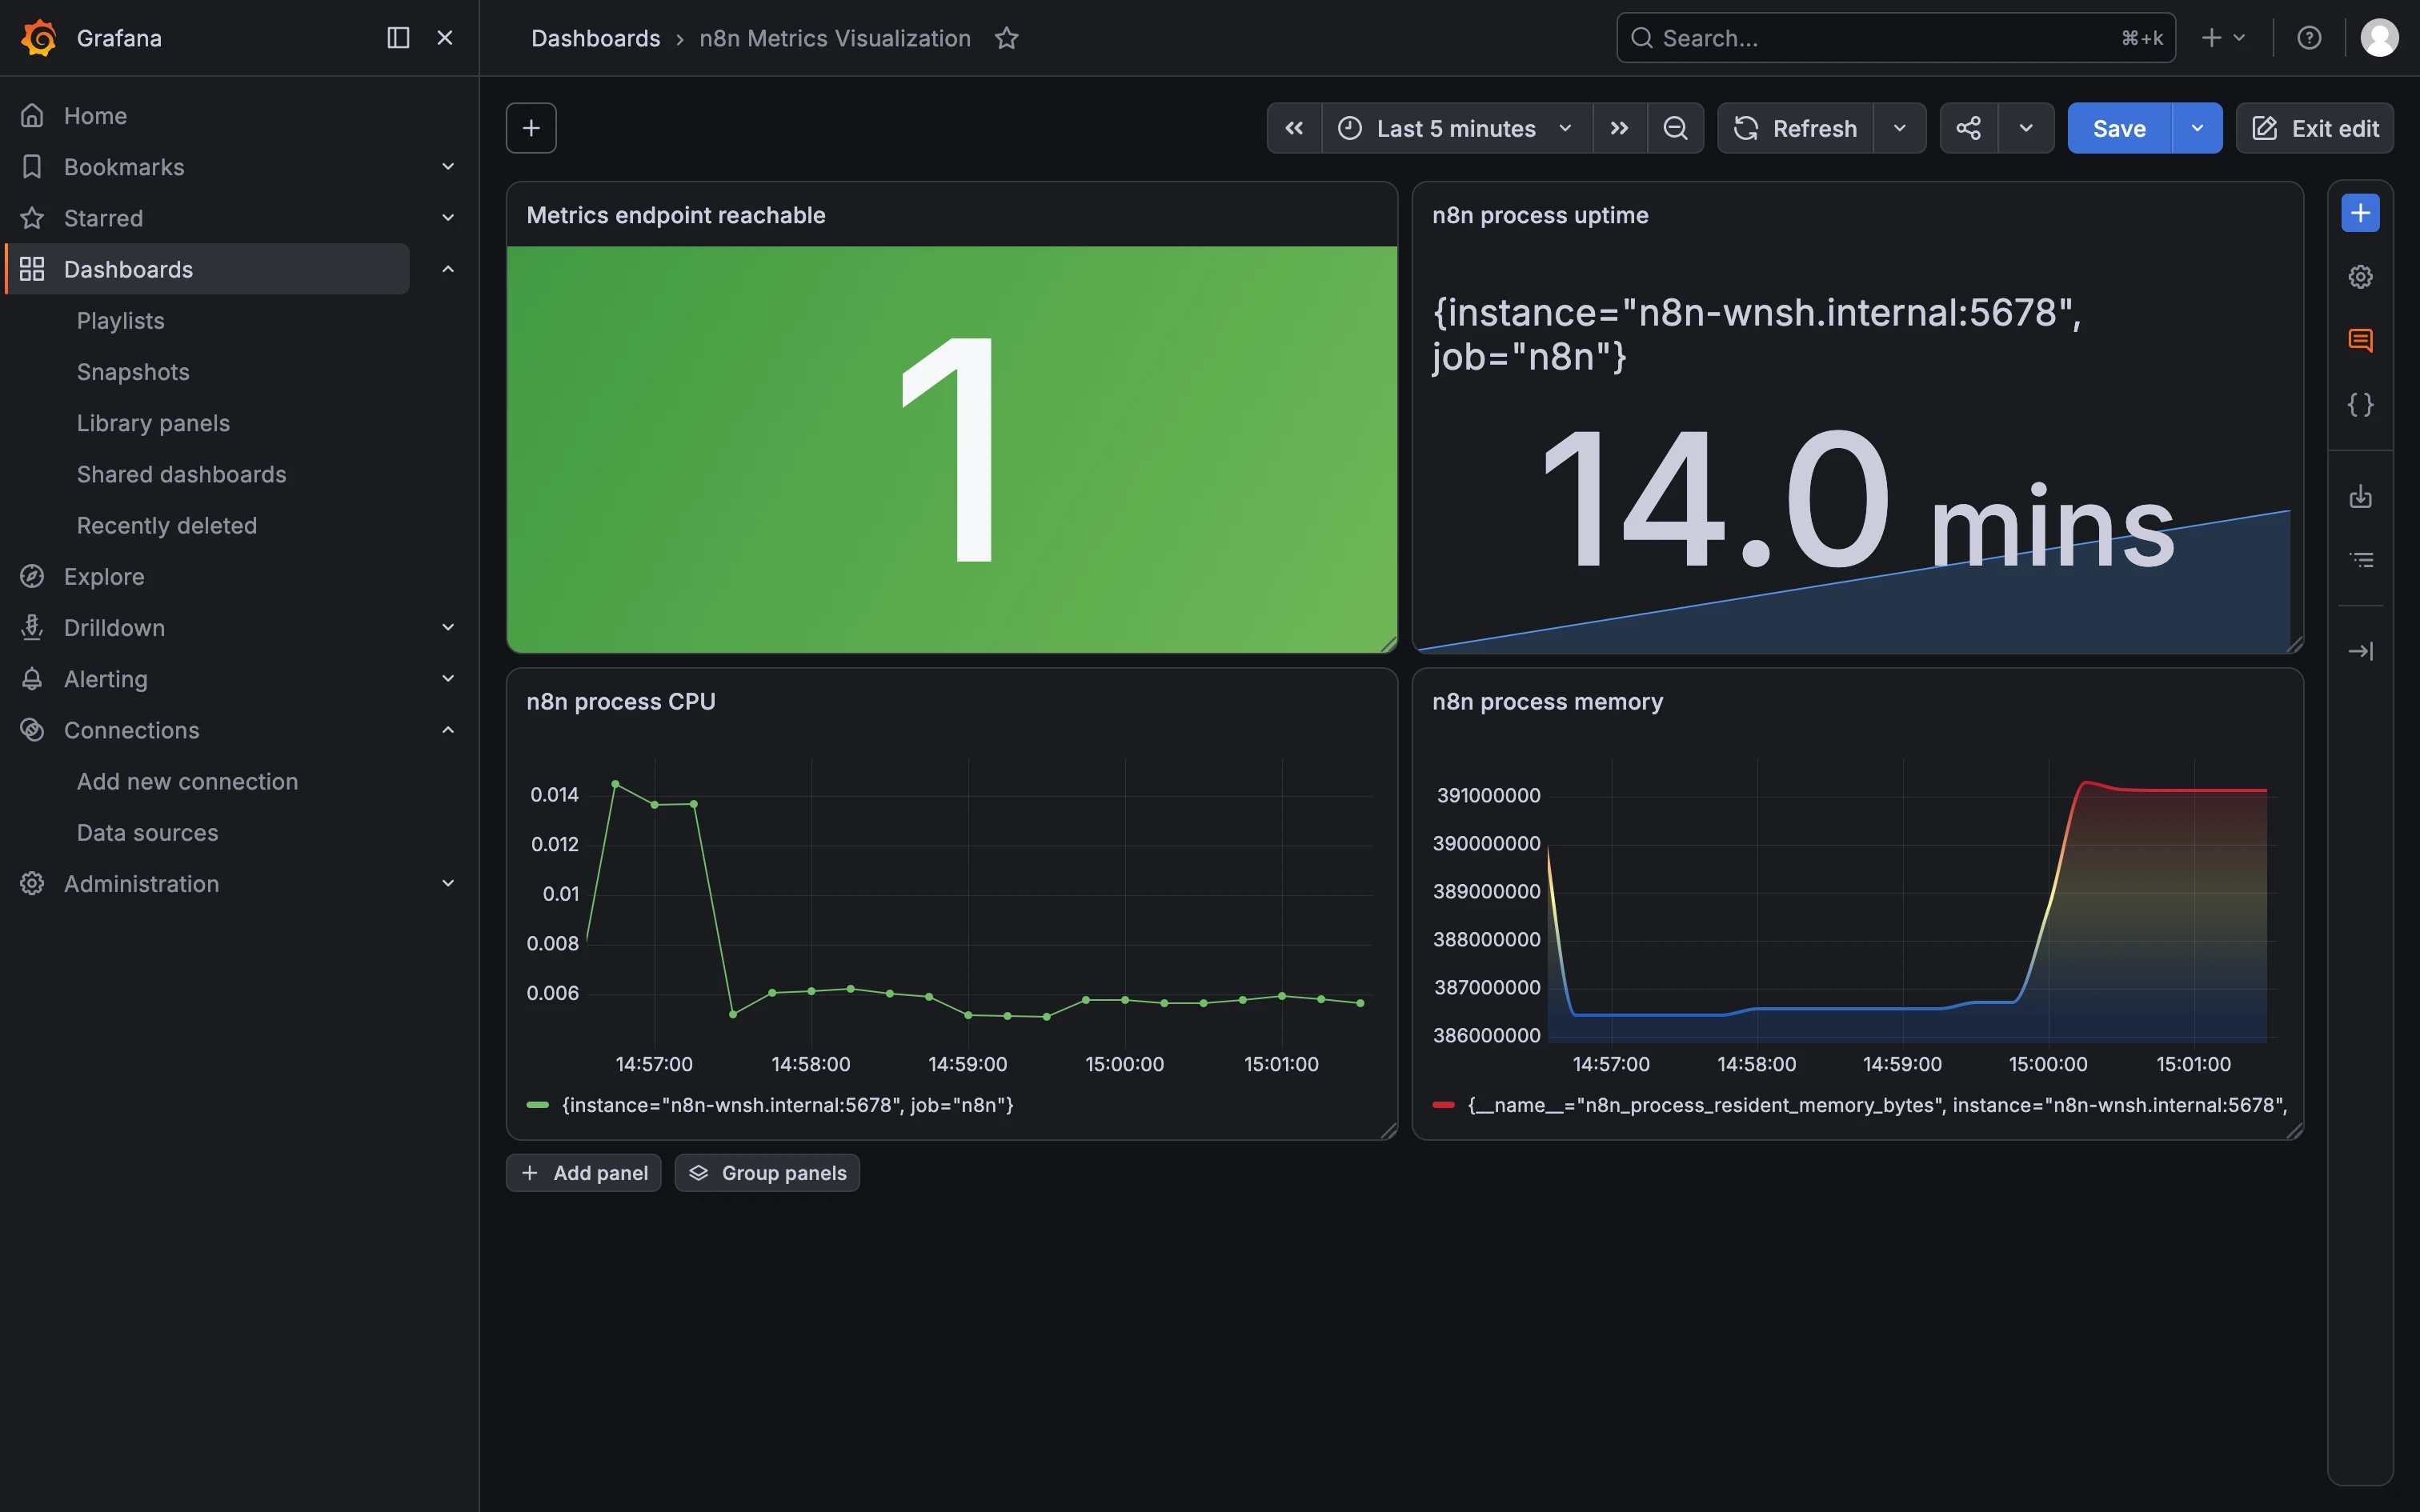
The process metrics come from the default collector used by n8n. Their definitions are available in the collector's memory, CPU, and process start time implementations.
A CPU value of 0.5 means the process used roughly half a CPU core over the query window. Memory is the n8n process's resident memory, so it won't necessarily match the total usage Sliplane reports for the container or server. Uptime resets when the n8n process restarts.
The up panel tells you whether Prometheus can collect metrics. A successful scrape doesn't prove that every workflow is completing successfully.
8. Add webhook metrics
For n8n 2.28.0 or later, you can also visualize webhook request volume and response time. Add this variable to your n8n service and redeploy:
N8N_METRICS_INCLUDE_WEBHOOK_METRICS=true
Create a small workflow with a Webhook trigger, set its response mode to Immediately, and publish it so its production URL is active. Call that URL a few times, wait for Prometheus to scrape, then make more requests. Give rate charts a few minutes to accumulate samples.
Add a time-series panel for requests per second:
sum by (workflow_id) (
  rate(n8n_webhook_request_duration_seconds_count{job="n8n"}[$__rate_interval])
)
Add another for p95 response time, with the unit set to seconds:
histogram_quantile(
  0.95,
  sum by (le) (
    rate(n8n_webhook_request_duration_seconds_bucket{job="n8n"}[$__rate_interval])
  )
)
This measures the time between receiving the webhook request and sending its response. With Immediately selected, the workflow can continue running after that response. Use these panels to understand webhook responsiveness; use execution metrics or n8n's execution history to investigate the full workflow. The histogram and its version requirement are documented in n8n's webhook observability guide.
Prefer a ready-made dashboard?
n8n maintains dashboard templates in its n8n-observability repository. Choose a dashboard, read its README for the required n8n version and environment variables, and download its JSON file.
In Grafana, open Dashboards > New > Import, upload the JSON, and select n8n-prometheus if prompted. If the imported dashboard references a different data source, update it to your connection. The Grafana import guide covers the available import methods.
Start with the four basic panels above even if you import a template. They give you a quick way to confirm that collection works before troubleshooting dashboard-specific metrics.
Troubleshooting
| What you see | What to check |
|---|---|
| Grafana's Save & test fails | Use Prometheus's actual internal hostname and port 9090. Confirm Grafana and Prometheus run on the same server. |
up{job="n8n"} returns 0 | Check n8n's internal hostname, port 5678, and whether N8N_METRICS=true was applied by a successful redeploy. |
up returns no data | Confirm the selected data source and job_name: n8n. Check that the image contains your updated configuration. |
| Process panels are empty | Enable default metrics, check the n8n_ prefix, and use the metric discovery query in step 6. |
| Webhook panels are empty | Confirm n8n is at least version 2.28.0, enable webhook metrics, and send requests to a published production webhook. |
| Prometheus fails during the build | Read the promtool output in the build log. Check YAML indentation and the target's host-and-port format. |
| Prometheus starts with a permission error | Confirm the volume is mounted at /prometheus and writable by the image's nobody user. |
| Metrics history disappears after deployment | Check that the same persistent volume is still attached at /prometheus, and that the missing period hasn't expired under your retention settings. |
Next steps
After saving the dashboard, run one of your usual workflows and watch how the process charts change. Keep n8n's execution history open alongside Grafana: a memory spike or CPU increase gives you a time window to investigate, and the execution history shows what was running then.
Observe the instance before adding alerts so you know what normal CPU, memory, and webhook latency look like. Set thresholds from that baseline, then test each alert with a controlled failure or load increase.